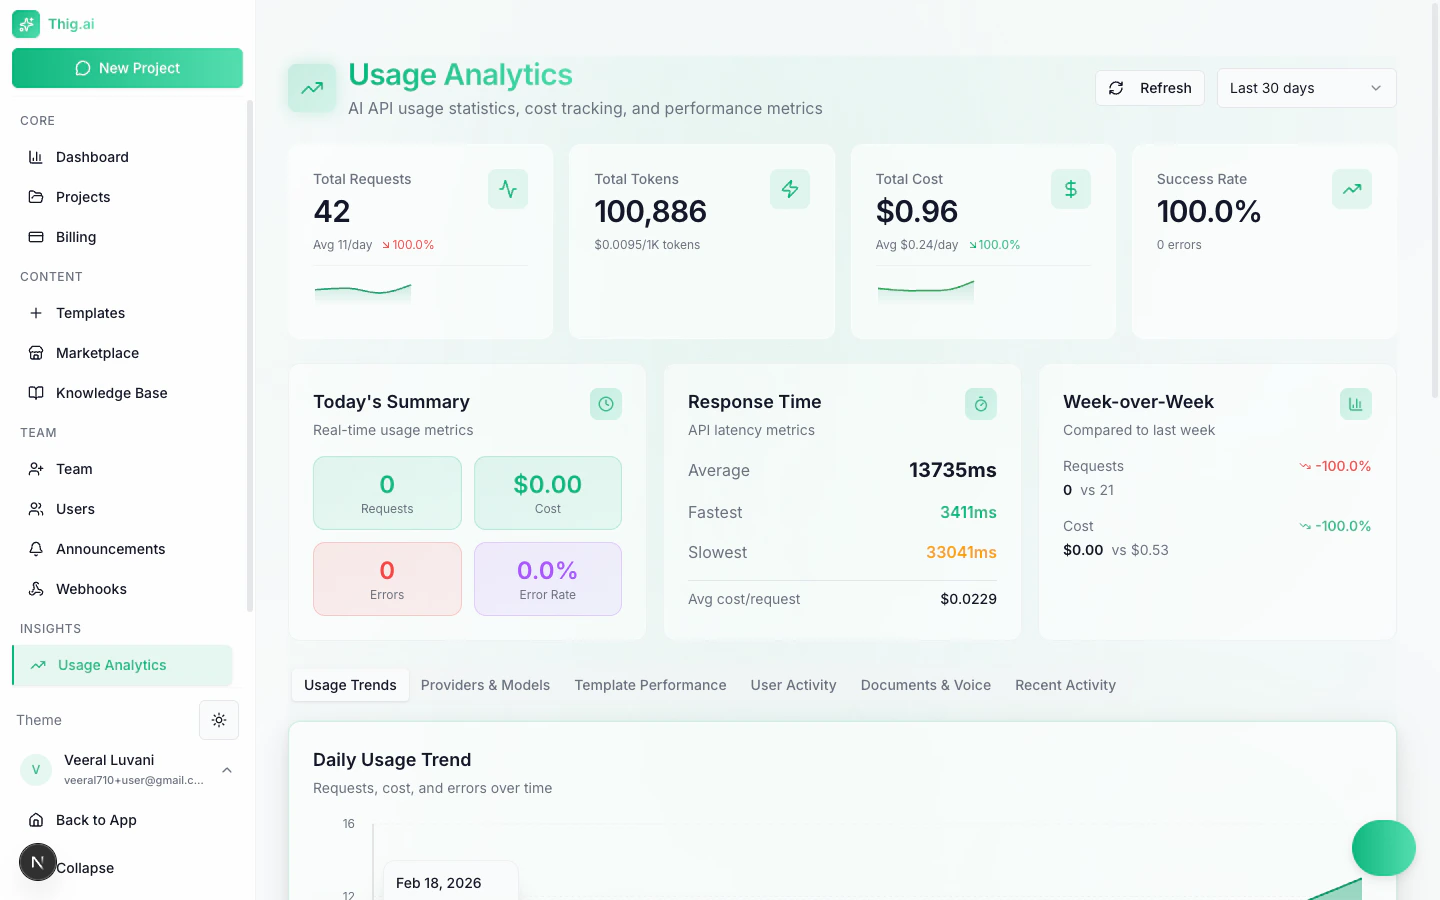
Usage Analytics
The Analytics page (/admin/analytics) provides visibility into your organization’s AI usage, costs, and performance trends. Use these insights to optimize spending and understand how your team uses AI-powered PRD generation.
Overview Stats
Three summary cards at the top of the page show key metrics:
| Metric | Description |
|---|
| Total Requests | Number of AI requests made across all team members |
| Total Tokens | Combined input and output tokens consumed |
| Estimated Cost | Calculated cost based on provider pricing and any configured markup |
Usage Over Time
A line chart visualizes AI usage trends over your selected time range. This helps you identify:
- Peak usage periods
- Growth trends in AI adoption across the team
- Unusual spikes that may indicate inefficient prompts or unexpected activity
Provider Breakdown
See which AI providers your organization is using and how usage is distributed:
- OpenAI — GPT-4, GPT-4o usage
- Anthropic — Claude model usage
- Google Gemini — Gemini model usage
The breakdown shows both request counts and token consumption per provider, helping you understand cost distribution across services.
Cost Tracking
Detailed cost metrics include:
- Per-request average cost — Average cost of each AI interaction
- Per-token metrics — Input vs. output token costs
- Provider-level costs — Cost breakdown by AI provider
- Trend analysis — Cost changes over time
If costs are higher than expected, check the provider breakdown. Switching default models or adjusting detail levels in AI Settings can significantly reduce token consumption.
Time Range Filtering
Use the time range selector to adjust the reporting period:
- Last 7 days — Recent activity snapshot
- Last 30 days — Monthly overview
- Last 90 days — Quarterly trends
- Custom range — Select specific start and end dates
Who Can Access Analytics
Analytics visibility is controlled by organization role and feature access settings:
| Role | Access |
|---|
| Owner | Full access |
| Admin | Full access |
| Member | Access only if enabled in Feature Access |
| Viewer | No access by default |
Analytics data is scoped to your organization. Each organization sees only its own usage metrics. BYOK (Bring Your Own Key) usage is tracked separately and costs reflect your own API pricing.
Optimizing AI Spending
Based on your analytics data, consider these strategies:
- Review provider distribution — Some providers offer better pricing for certain use cases
- Adjust detail levels — Lower detail settings consume fewer tokens
- Use templates — Well-structured templates reduce back-and-forth, lowering token usage
- Enable BYOK — Power users with their own API keys reduce organization pool costs